
General Marketing
Don’t Pay for Beta: Measure the Alpha CTV Actually Creates
A fund manager up 18% in a year the S&P returned 17% did not have a good year. He had one percent of skill and seventeen percent of market. CTV measurement has the exact same problem — and almost nobody is running the experiment that solves it.
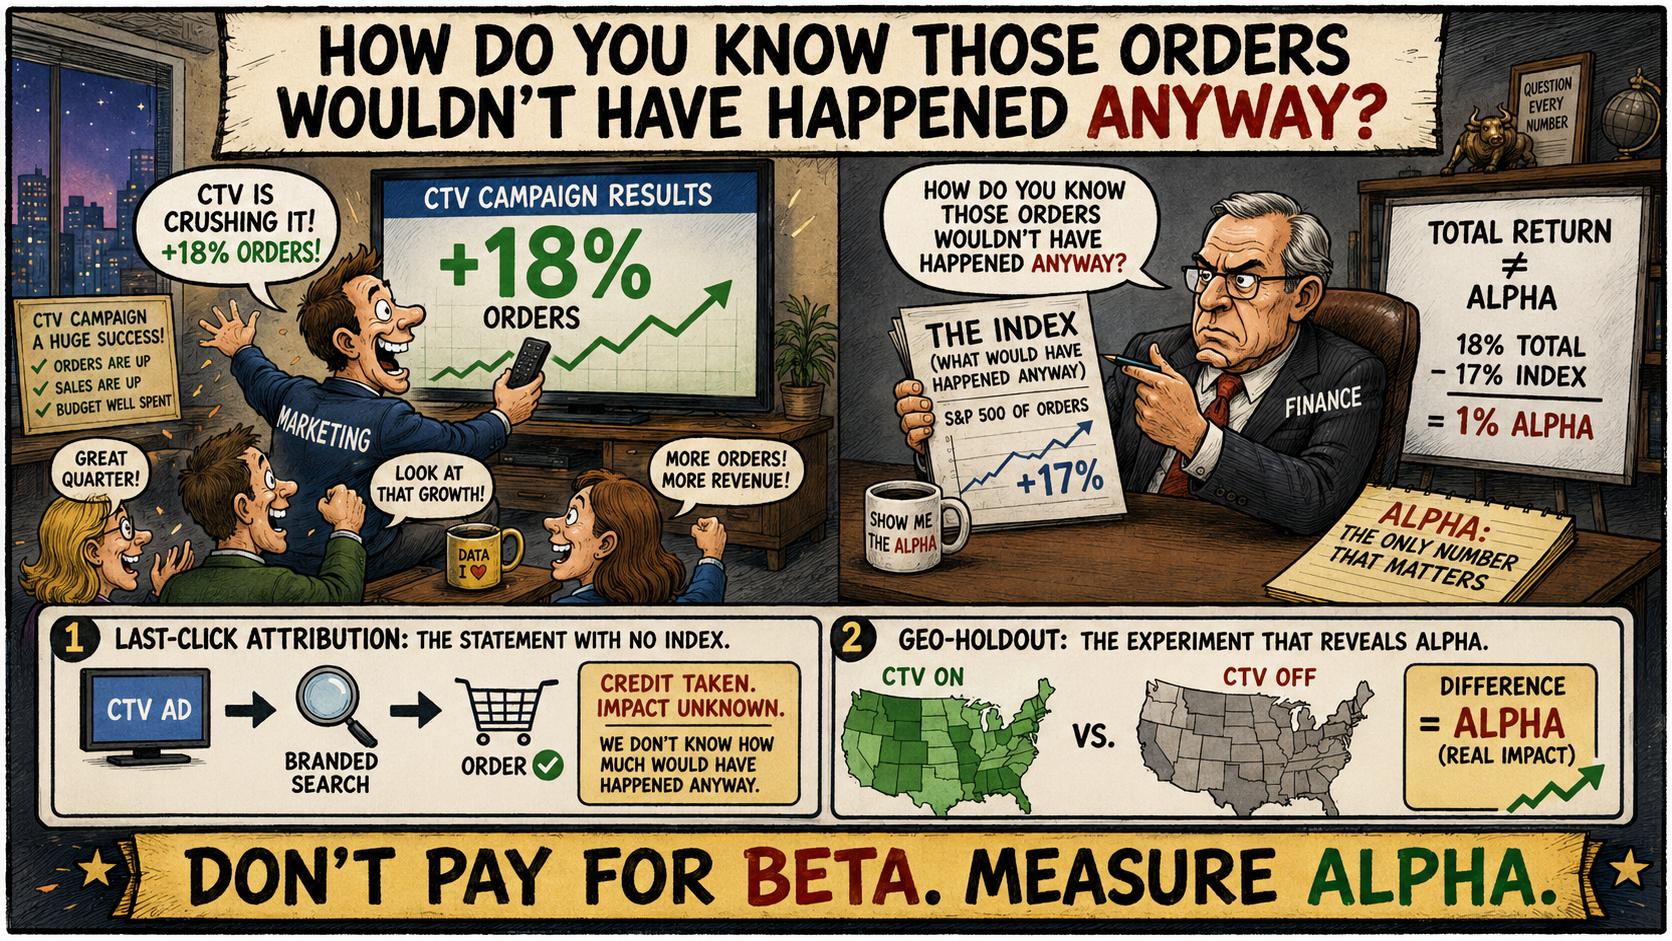
A fund manager finishes the year up eighteen percent.
He sends the letter to his investors. He charges his fee. He tells everyone he had a great year.
The S&P 500 was up seventeen percent.
The fund manager generated one percent of value. The other seventeen percent was the market.
That one percent has a name. It is called alpha. It is the only number that matters. It is the only thing the manager actually did.
The other seventeen percent is called beta. It is what would have happened anyway.
Every sophisticated investor in the world knows the difference. They have known it for fifty years. They built an entire industry around measuring it. They will not pay active fees for beta.
CTV advertising has the exact same problem.
And almost nobody is asking the same question.
Your Orders Have an Index
You ran a CTV campaign. Orders went up.
That is your eighteen percent.
But here is the question your CFO is about to ask.
"How much of that would have happened without the ad?"
That is the S&P. That is beta. That is the index your CTV campaign is competing against — and if you have never measured it, you have no idea whether you are generating alpha or just paying active fees for the market.
The orders that would have arrived anyway. The customers who were already going to convert. The branded searches that would have happened because someone heard about you from a friend or saw you in a podcast or remembered the brand from a year ago.
That is your beta.
Your alpha is the orders that would not have existed without the impression. The customers who only converted because they saw you on Hulu three nights ago. The branded searches that only happened because the ad triggered them.
That is what the ad actually did.
If you cannot separate the two, you do not have a performance channel. You have a portfolio with no benchmark.
Last-Click Attribution Is the Statement With No Index
This is what every CTV dashboard does.
It shows you total return. Orders. Revenue. Branded search lift. Direct traffic. All of it.
It does not show you what would have happened in a market where the ad never ran.
Last-click attribution tells you a customer arrived through Google. It does not tell you that the customer Googled your name because they saw your ad on Peacock.
Multi-touch attribution tells you which touchpoints the customer encountered. It does not tell you which touchpoints the customer would have encountered if the television ad never existed.
Completion rate tells you the ad played. It does not tell you that anyone did anything about it.
These are total-return numbers. They include the market. They include the beta. They include every order that was going to happen anyway.
You cannot tell the difference between a great campaign and a great quarter for the category.
You cannot tell the difference between alpha and beta.
You are looking at the eighteen percent and calling it a victory.
The Index Fund for Your Television Ad
The investment world figured this out with a single invention.
The index fund.
You build a portfolio. You compare it to the index. The difference is what you actually did.
CTV has the same invention. It is called the geo-holdout.
You pick a market. Georgia. Phoenix. Charlotte. You turn CTV off in that market entirely. You keep it running everywhere else. You wait six weeks. Eight weeks. Twelve.
Then you compare.
The markets running CTV are your portfolio. The market without CTV is your index. The gap between them is your alpha.
If orders declined in Georgia relative to control, the ad was working. If they did not decline, the ad was beta. You were paying for the market.
This is not theory. A national home goods brand ran this test. Four weeks. CTV on in some markets, CTV off in others. The markets without CTV saw a five percent revenue decline relative to control.
Five percent of revenue. Gone. Because the television ad stopped running.
That five percent is alpha. It is the work the ad actually did. It is the orders that would not have existed.
The rest was beta.
225 Portfolios. One Verdict.
If one test is not enough, here are 225 more.
The Stella 2025 benchmark measured 225 geo-based incrementality tests across every major digital channel. Not platform-reported numbers. Not view-through guesses. Causal experiments. The portfolio compared against the index, run 225 times, across hundreds of brands.
CTV produced a median incremental ROAS of 3.30x.
For every dollar spent, three dollars and thirty cents in revenue was causally attributable to the impression. Alpha. Not correlated revenue. Caused revenue.
Meta came in at 2.92x. Google Performance Max at 2.98x. Both strong. Both real alpha.
And Google branded search — the channel your last-click dashboard credits with most of CTV's work — came in at 0.70x.
Read that again.
Branded search returns seventy cents on the dollar when measured for true incrementality.
It is not generating alpha. It is generating negative alpha. The brand was going to be searched anyway. The dollars being spent on branded search are catching demand that something else created.
That something else, in most DTC funnels with CTV running upstream, is the television ad.
The customer saw your ad on Peacock. Three days later they typed your brand name into Google. Google got the click. Google got the credit.
But CTV did the work. 225 controlled experiments proved it.
The Ghost in the Auction
There is a second way to measure alpha. It is even more precise.
It is called the ghost ad.
Your demand-side platform identifies every household that would have been served your ad. It splits them into two groups. One group sees the ad. The other group sees nothing — the platform records that an ad would have been served and withholds it.
Same targeting. Same demographics. Same behavioral profile. Same inventory eligibility. The only difference is whether the ad ran.
Then you compare. Did the group that saw the ad search for your brand more? Visit your site more? Buy more?
The difference is alpha.
Not estimated. Not modeled. Measured.
The academic foundation comes from Johnson, Lewis, and Nubbemeyer — the same research lineage as the Lewis and Rao paper we have written about previously. Peer-reviewed. Published. The methodology is not new. It is simply underused.
Ghost ads are the index fund at the household level. The geo-holdout is the index fund at the market level. Both answer the same question.
Did you generate alpha, or did you just buy beta?
Run the test. Find out.
The Search That Tells You the Truth
There is a simpler signal that does not require a formal experiment.
Watch your branded search volume by DMA.
When CTV is heavy in a market, branded searches rise. When CTV goes dark, branded searches fall. Track the relationship. If branded search tracks your CTV spend by geography — up where CTV is strong, flat where it is light, down where it goes dark — you are looking at the fingerprint of alpha.
This is not proof. The geo-holdout is proof. But it is evidence strong enough to justify running the test.
CTV does not generate clicks. It generates searches. The viewer does not tap the screen. They pick up their phone three days later and type your name.
That search is the echo of the impression. And it is measurable, free, and visible in every Google Search Console you already own.
If you have never overlaid your CTV spend curve against your branded search curve by DMA, you are leaving evidence on the table.
The Cheapest Test Nobody Runs
One question.
On the order confirmation page. In the post-purchase email.
"How did you first hear about us?"
Television ad. Online search. Social media. Friend. Podcast. Other.
It is self-reported. It is imperfect. People forget. People misremember.
But at scale — hundreds of responses per month — the signal becomes real.
If thirty-five percent of new customers say they first heard about you through a television ad, and your CTV budget is twelve percent of your total media spend, that gap demands explanation.
The explanation is that CTV is generating alpha your attribution platform cannot see.
A post-purchase survey does not prove causation the way a geo-holdout does. But it costs nothing. It runs forever. And it captures what no pixel ever will — the customer's own memory of what made them act.
The Paradox
Here is the part nobody talks about.
The CFO who demands proof is often the same CFO who will not approve the test.
A geo-holdout means turning CTV off in a market. For eight weeks. Maybe twelve. In a market where revenue might decline.
"Prove the channel is generating alpha."
"Okay. Let me turn it off in Georgia for three months."
"Absolutely not."
This is the paradox. The person asking the question will not let you answer it.
The way through is to reframe the test.
A geo-holdout is not a risk. It is the index fund the entire portfolio depends on.
If CTV is not generating alpha, the holdout saves you every dollar you would have continued to waste on beta. If CTV is generating alpha, the holdout produces the causal evidence that unlocks scale — because a CFO who has seen a statistically significant decline in the dark market will fund the next budget increase without hesitation.
The test either saves money or makes the case for more money.
There is no scenario in which it is the wrong move.
The Real Cost of Never Asking
The brands that answer this question do not just get better measurement.
They get a structural advantage over every competitor who never asked.
Because once you have causal proof that CTV returns 3.30x incremental ROAS, you can scale with confidence. Every marginal dollar produces alpha you can defend in a board meeting with evidence no other channel in the mix can match.
Your competitor — the one who looked at the same ambiguous dashboard and decided "we cannot prove it works" — just pulled the budget. They went back to Meta. They are paying more for the same audiences. They are competing in a red ocean while you are farming a blue one.
They did not lose because their product was worse. They did not lose because their creative was weaker.
They lost because they were paying active fees for beta and never measured the difference.
The question "would those orders have happened anyway" is not an obstacle.
It is a filter.
It separates the brands that measure alpha from the brands that measure total return.
The brands on the right side of that filter compound an advantage every quarter the test runs.
The Final Take
Yes. Some of those orders would have happened anyway.
That is true on every channel. It is true on Meta. It is true on Google. It is true on CTV.
The question is not whether some orders are beta.
The question is how much.
And the only way to answer it is to run the experiment that advertising has been avoiding for twenty years.
Turn it off somewhere. Measure what happens. Compare.
When you do that on CTV, the answer is better than almost anyone expects.
3.30x incremental ROAS. The highest of any channel tested. 225 controlled experiments. 88.4% reaching statistical significance.
That is alpha. That is the work the ad actually did. That is the number the dashboard will never show you because the dashboard was built to report total return.
The orders were not going to happen anyway.
The television ad made them happen.
But only if you run the test.